Quiz Summary
0 of 16 Questions completed
Questions:
Information
You have already completed the quiz before. Hence you can not start it again.
Quiz is loading…
You must sign in or sign up to start the quiz.
You must first complete the following:
Results
Results
0 of 16 Questions answered correctly
Your time:
Time has elapsed
You have reached 0 of 0 point(s), (0)
Earned Point(s): 0 of 0, (0)
0 Essay(s) Pending (Possible Point(s): 0)
Categories
- IMO-2-Pictograph 0%
- 1
- 2
- 3
- 4
- 5
- 6
- 7
- 8
- 9
- 10
- 11
- 12
- 13
- 14
- 15
- 16
- Current
- Review
- Answered
- Correct
- Incorrect
- Question 1 of 16
1. Question
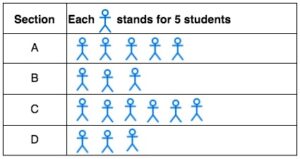
The following pictograph shows the number of students in each section of a class.

Find the Section which has the maximum number of students?
CorrectIncorrect - Question 2 of 16
2. Question
The following pictograph shows the number of students in each section of a class.
How many students are there in Section-C?
CorrectIncorrect - Question 3 of 16
3. Question
The following pictograph shows the number of students in each section of a class.
How many students are there in total considering all Sections?
CorrectIncorrect - Question 4 of 16
4. Question
The following pictograph shows the number of students in each section of a class.
Which Sections has same no. of students?
CorrectIncorrect - Question 5 of 16
5. Question
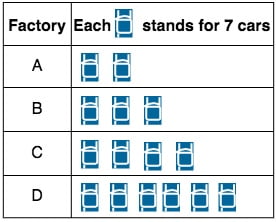
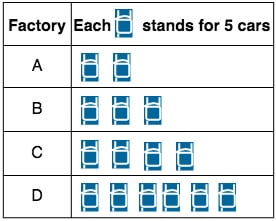
The following pictograph shows the number of cars manufactured by 4 factories.
The Factory which manufactures maximum number of cars : ________
CorrectIncorrect - Question 6 of 16
6. Question
The following pictograph shows the number of cars manufactured by 4 factories.
The total number of cars manufactured by factory C:_______
CorrectIncorrect - Question 7 of 16
7. Question
The following pictograph shows the number of cars manufactured by 4 factories.
How many more cars manufactured by factory D than by factory B?
CorrectIncorrect - Question 8 of 16
8. Question
The following pictograph shows the number of cars manufactured by 4 factories.
How many cars manufactured by all the factories together?
CorrectIncorrect - Question 9 of 16
9. Question
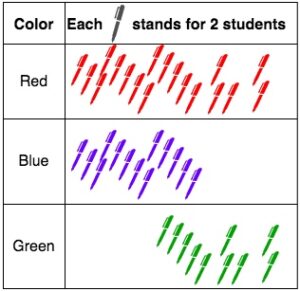
The following pictograph shows the types of colours various students prefer.
How many students prefer blue?
CorrectIncorrect - Question 10 of 16
10. Question
The following pictograph shows the types of colours various students prefer.
Which one is the most favourite colour of students?
CorrectIncorrect - Question 11 of 16
11. Question
The following pictograph shows the types of colours various students prefer.
How many more students prefer blue than green?
CorrectIncorrect - Question 12 of 16
12. Question
The following pictograph shows the types of colours various students prefer.
Which colour is least liked by students?
CorrectIncorrect - Question 13 of 16
13. Question
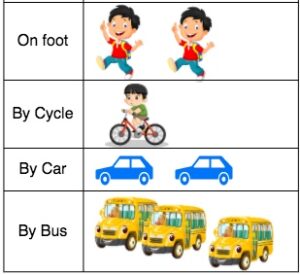
The following pictograph shows the number of students using various modes of transportation for going to their schools.
If each picture represents 45 students using a particular mode then how many students go to school on foot?
CorrectIncorrect - Question 14 of 16
14. Question
The following pictograph shows the number of students using various modes of transportation for going to their schools.
If each picture represents 35 students using a particular mode then how many students go to school by school bus?
CorrectIncorrect - Question 15 of 16
15. Question
The following pictograph shows the number of students using various modes of transportation for going to their schools.
If each picture represents 30 students using a particular mode then what is the total number of students in the school?
CorrectIncorrect - Question 16 of 16
16. Question
The following pictograph shows the number of students using various modes of transportation for going to their schools.
If each picture represents 40 students using a particular mode then which mode of transport is used by maximum number of students?
CorrectIncorrect